Mount Pleasant is one of Brampton's newest neighbourhoods, and the numbers show it. Population grew from 6,067 in 2016 to 29,669 in 2021, and of the 7,565 occupied private dwellings, 5,625 were built between 2016 and 2021 alone, with another 1,705 built from 2011 to 2015. Detached houses make up 66% of homes, with townhouses at 18% and semi-detached at 10%.
Most residents own rather than rent, at 81% owners to 19% renters. Households tend to be larger, averaging 4 people, and median household income was $119,000 in 2020. In the 2021 Census, owners put the value of their homes at $1,000,000 (median) and $1,073,000 (average). Punjabi, Hindi, Urdu, Gujarati and Tamil are all commonly spoken at home, reflecting the mix of families who have settled here, many with young children, as 7,865 residents are under 15.
The sections below go further into the homes, who lives here, getting around, schools, and new homes nearby.
Mount Pleasant at a glance
People
29,669
up 389% since 2016
Own their home
81%
19% rent
Most common home
66%
detached houses
Largest building era
2016 to 2021
by homes still standing
Source: Statistics Canada, Census 2021, by census tract via the Region of Peel and City of Brampton open data. Region of Peel Open Data Licence v1.0; Statistics Canada Open Licence; City of Brampton open data.
The homes
7,565 occupied private dwellings in the 2021 Census.
What kind
- Detached houses66% · 5,000
- Townhouses18% · 1,395
- Semi-detached houses10% · 760
- Apartments in buildings of five storeys or more3% · 220
- Duplex apartments2% · 180
- Other attached houses0% · 10
- Low-rise apartments0% · 5
- Movable dwellings0% · 0
When they were built
- 2016 to 202175% · 5,625
- 2011 to 201523% · 1,705
- 2001 to 20051% · 70
- 2006 to 20101% · 60
- 1981 to 19900% · 25
- 1991 to 20000% · 20
- 1960 or before0% · 15
- 1961 to 19800% · 10
Average household size: 4.
Source: Statistics Canada, Census 2021, by census tract via the Region of Peel and City of Brampton open data. Region of Peel Open Data Licence v1.0; Statistics Canada Open Licence; City of Brampton open data.
Who lives here
Households
7,565
Median household income
$119,000
2020 income, 2021 Census
Age mix
27% · 68% · 6%
0 to 14 · 15 to 64 · 65+
Besides English and French, the languages spoken most often at home are Punjabi (9,665), Hindi (7,195), Urdu (2,605), Gujarati (1,870) and Tamil (1,760).
Source: Statistics Canada, Census 2021, by census tract via the Region of Peel and City of Brampton open data. Region of Peel Open Data Licence v1.0; Statistics Canada Open Licence; City of Brampton open data.
Getting around
- Mount Pleasant · GO
Stations inside or within a short walk of the boundary, from TTC and Metrolinx open data.
Schools in Mount Pleasant
Publicly funded schools inside the boundary. Where a school draws its students from is set by its board, not by this page.
Aylesbury Public School
Elementary · Peel DSB · Brampton
EQAO, share at the provincial standard (2023-2024): Gr 3 reading 56% · Gr 3 writing 47% · Gr 3 math 52% · Gr 6 reading 74% · Gr 6 writing 74% · Gr 6 math 41%
Dolson Public School
Elementary · Peel DSB · Brampton
EQAO, share at the provincial standard (2023-2024): Gr 3 reading 71% · Gr 3 writing 67% · Gr 3 math 74% · Gr 6 reading 86% · Gr 6 writing 81% · Gr 6 math 44%
Red Cedar PS (Elementary)
Elementary · Peel DSB · Brampton
St. Carlo Acutis Catholic Elementary School
Elementary · Dufferin-Peel CDSB · Brampton
St. Daniel Comboni Catholic Elementary School
Elementary · Dufferin-Peel CDSB · Brampton
EQAO, share at the provincial standard (2023-2024): Gr 3 reading 69% · Gr 3 writing 58% · Gr 3 math 55% · Gr 6 reading 85% · Gr 6 writing 81% · Gr 6 math 35%
Tribune Drive Public School
Elementary · Peel DSB · Brampton
EQAO, share at the provincial standard (2023-2024): Gr 3 reading 70% · Gr 3 writing 57% · Gr 3 math 52% · Gr 6 reading 86% · Gr 6 writing 80% · Gr 6 math 47%
Source: Ontario Ministry of Education, school information and student demographics. Open Government Licence – Ontario. EQAO results are the school's own, shown as published, not a ranking.
New homes in Mount Pleasant
3 projects inside the boundary on LIQWD, then the nearest in Brampton.
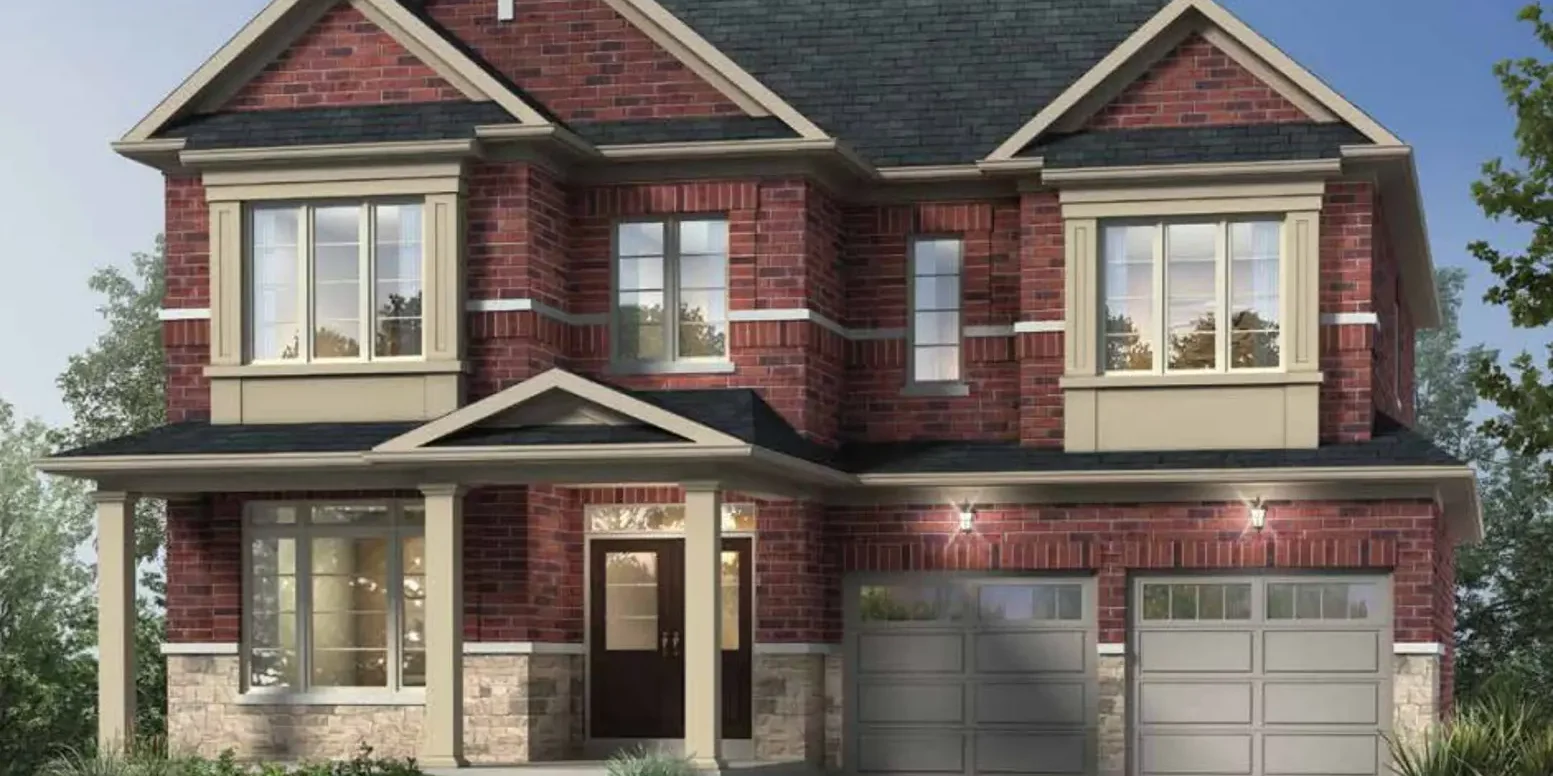
High Point
Paradise Developments · In Mount Pleasant
From From $769,990
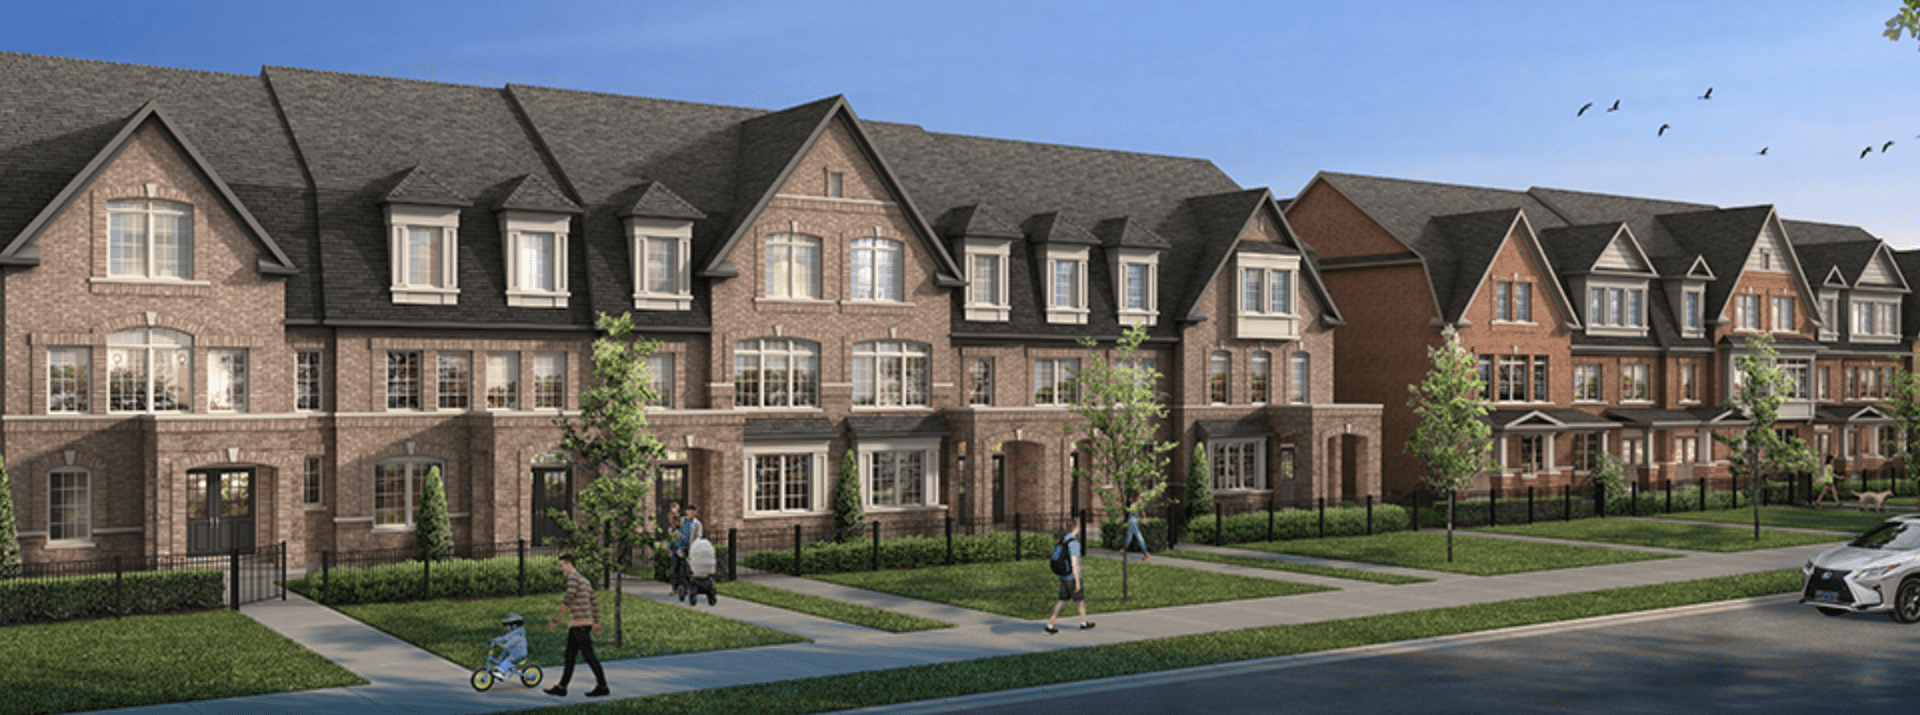
West Grove
Paradise Developments · In Mount Pleasant
From From $1,600,000

Cornerstone
Primont Homes · In Mount Pleasant
From From $600,000
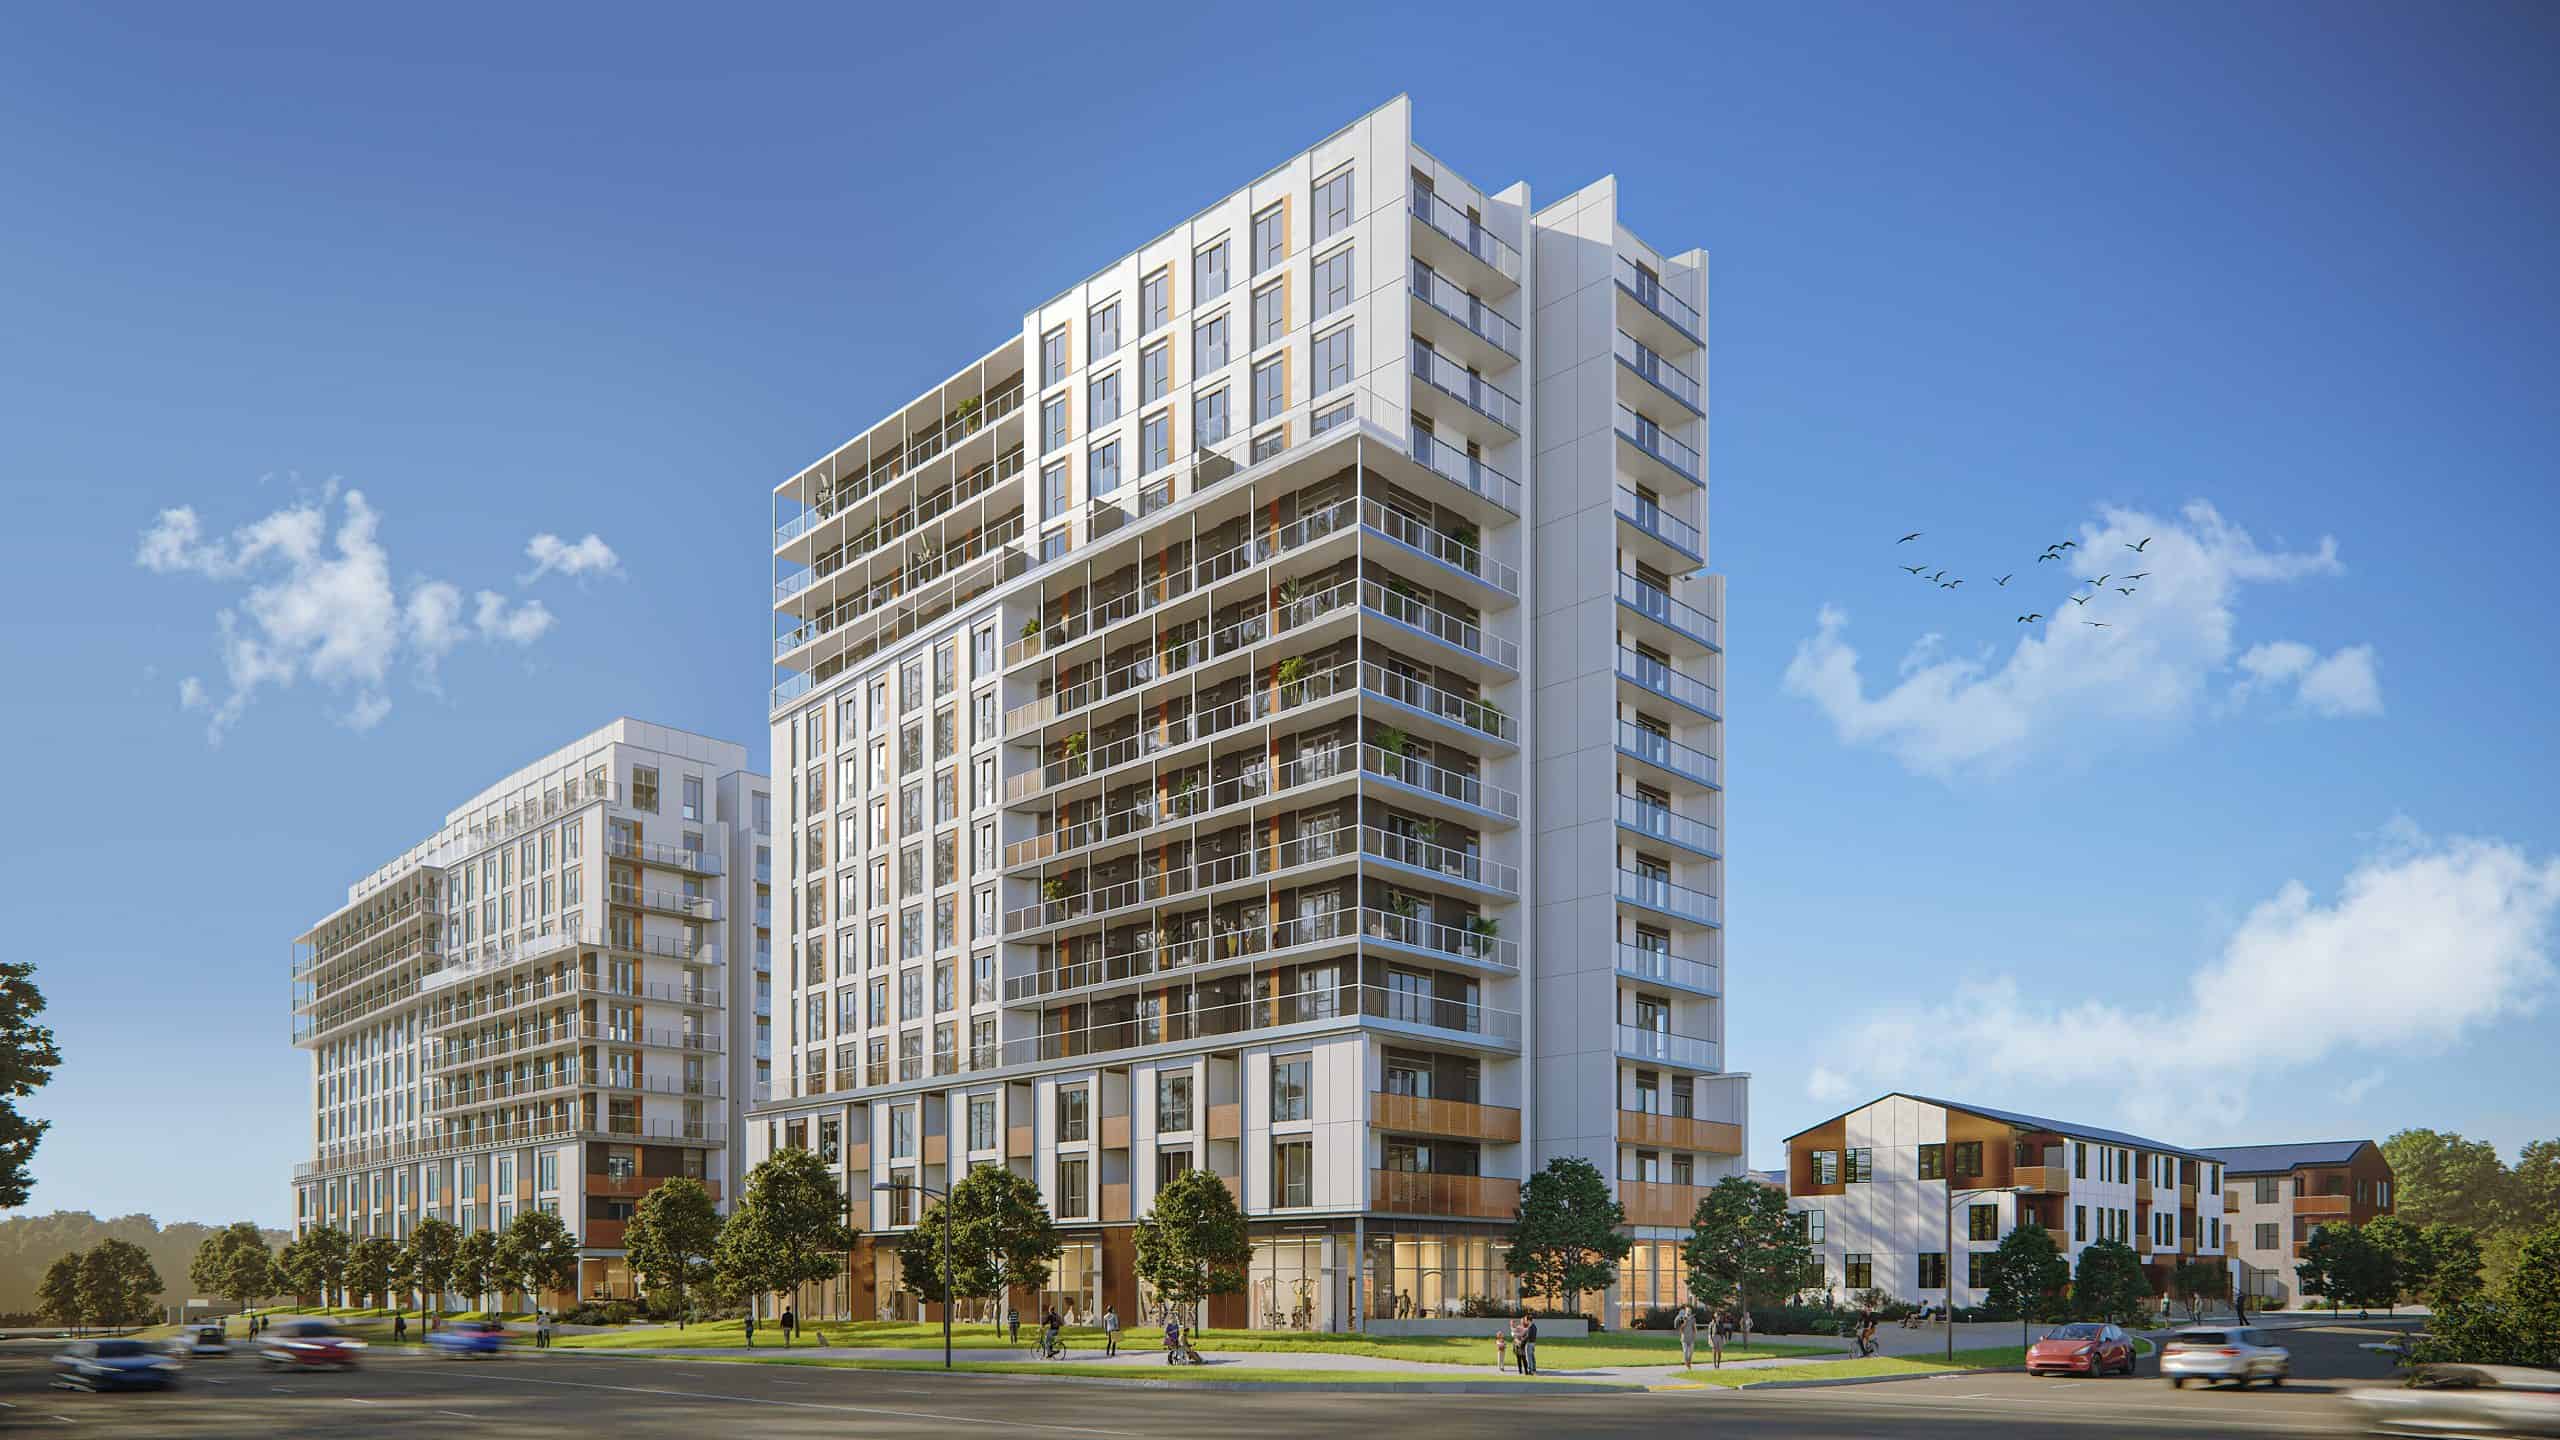
Daniels MPV 2 - West Tower
Daniels Corporation · Mount Pleasant Village
From From $557,900
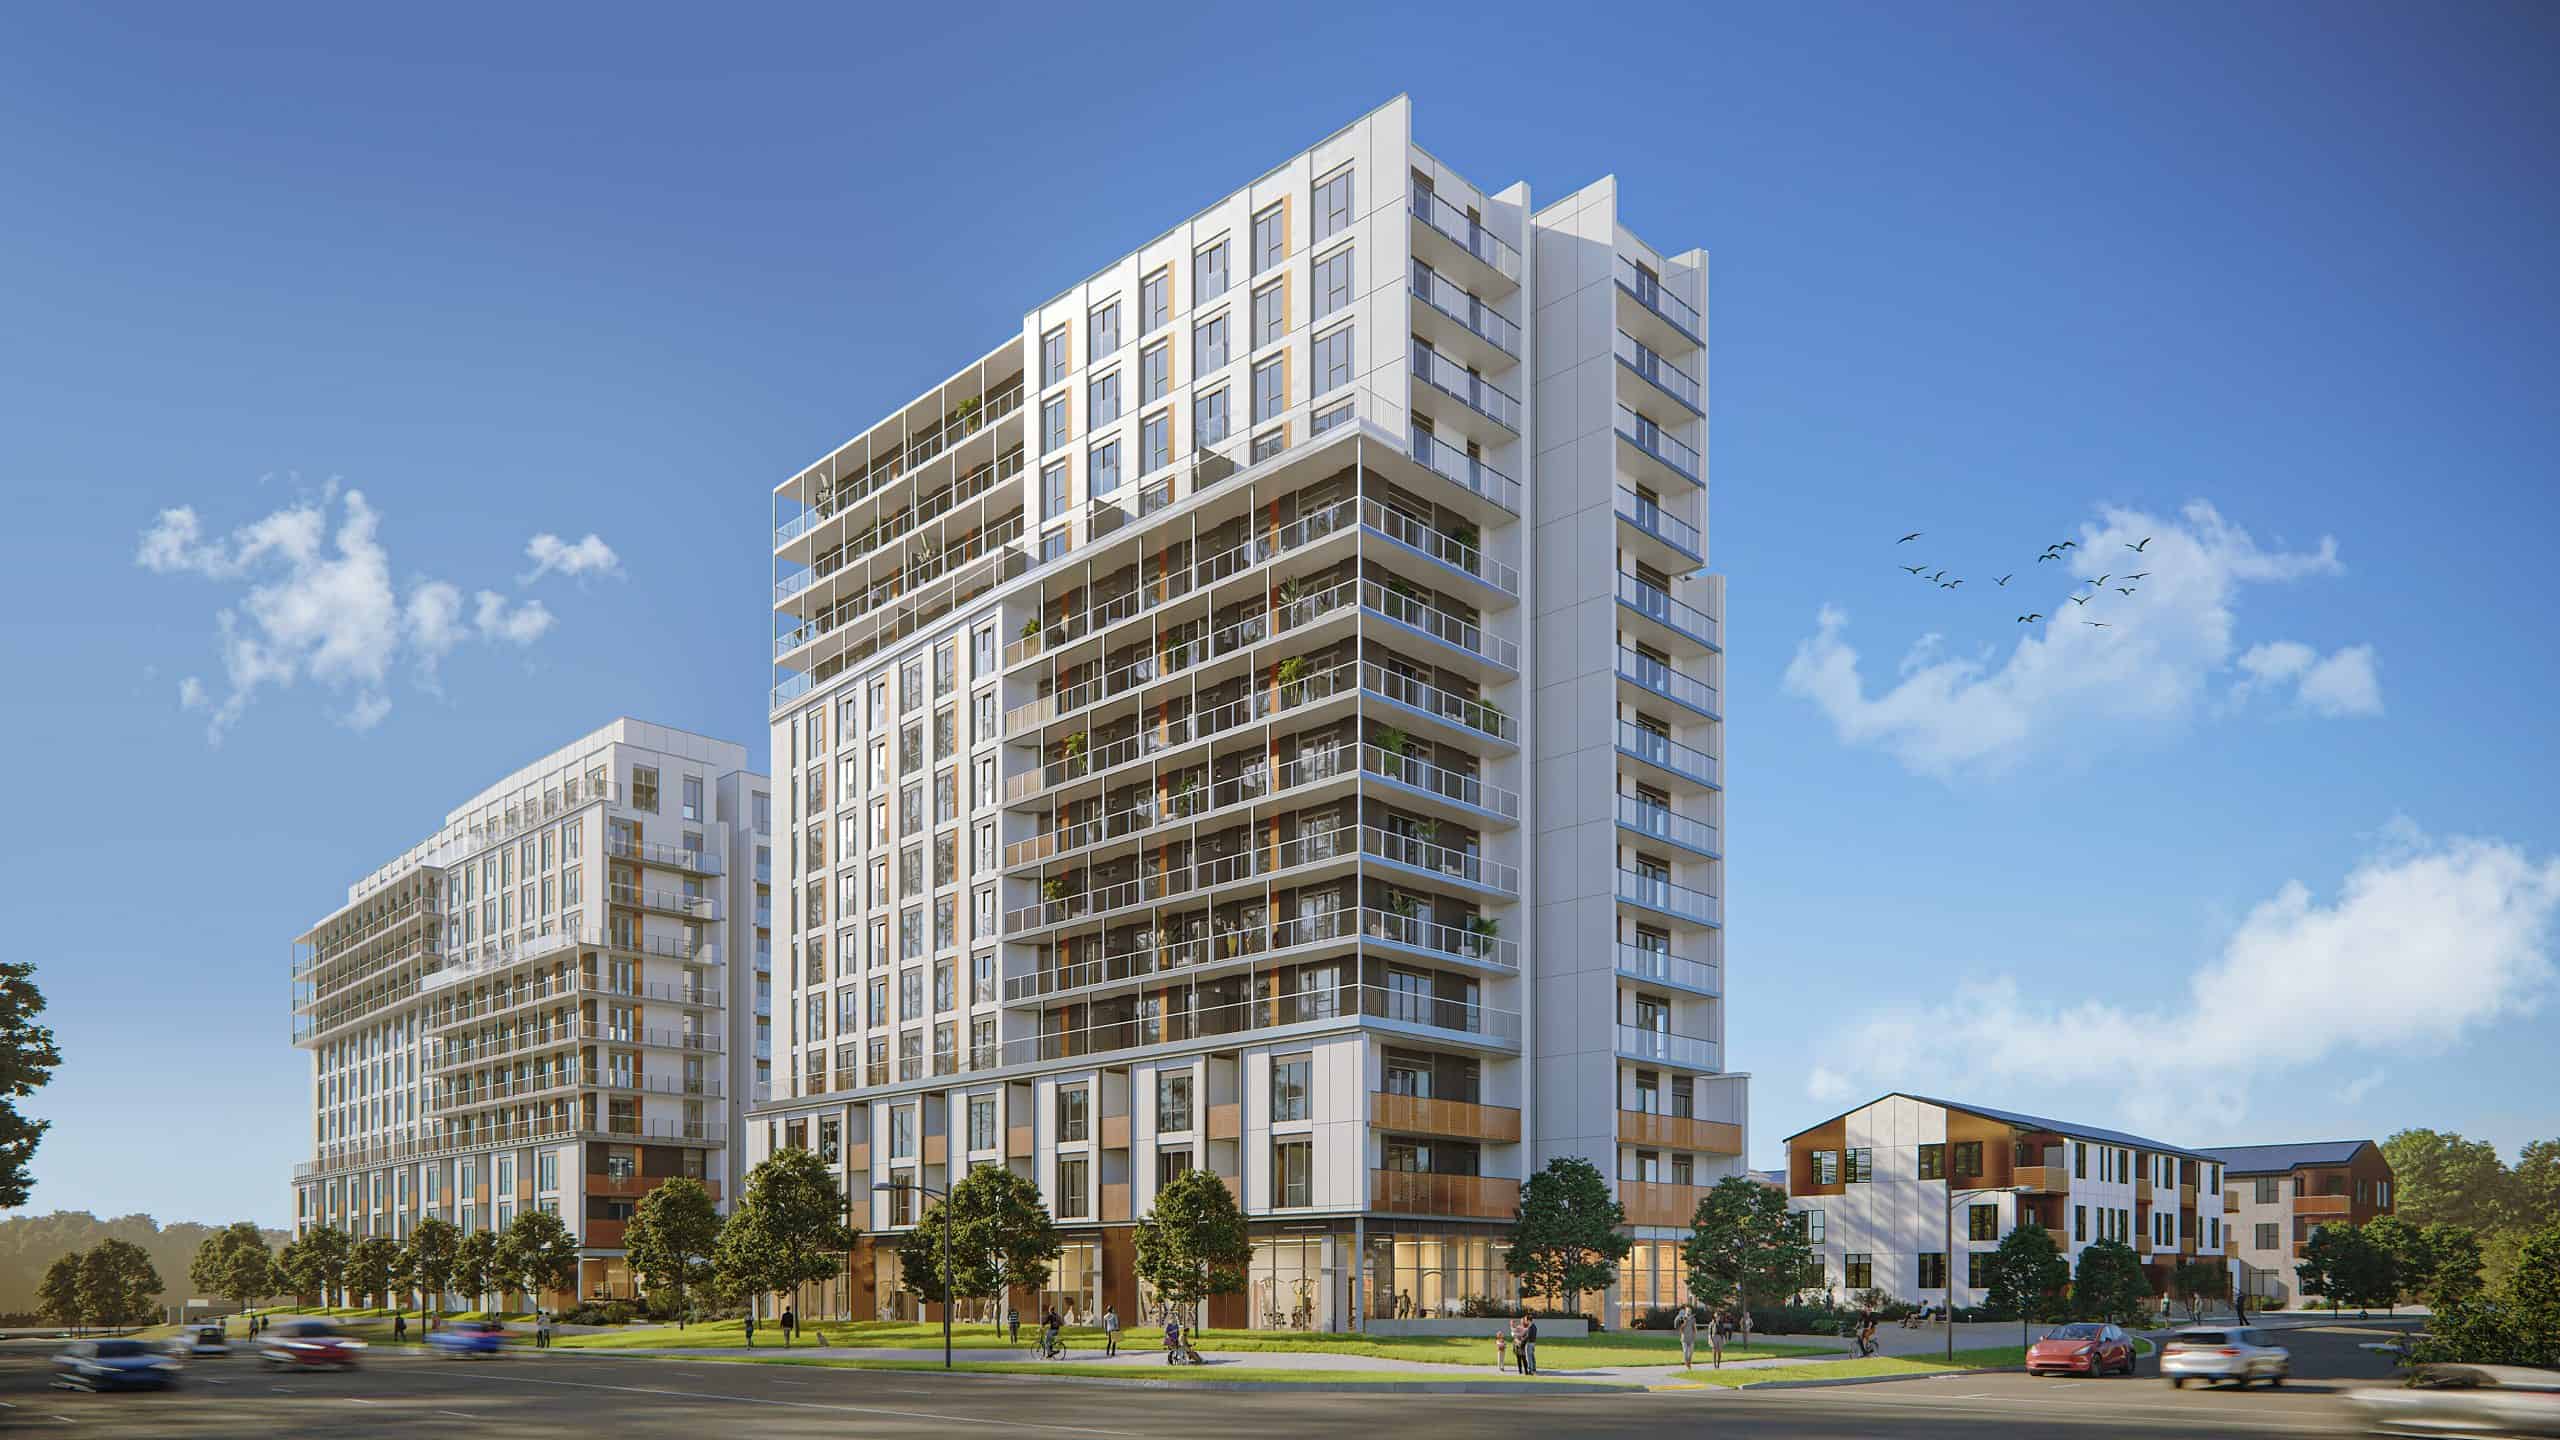
Daniels MPV 2 - East Tower
Daniels Corporation · Mount Pleasant Village
From From $609,900
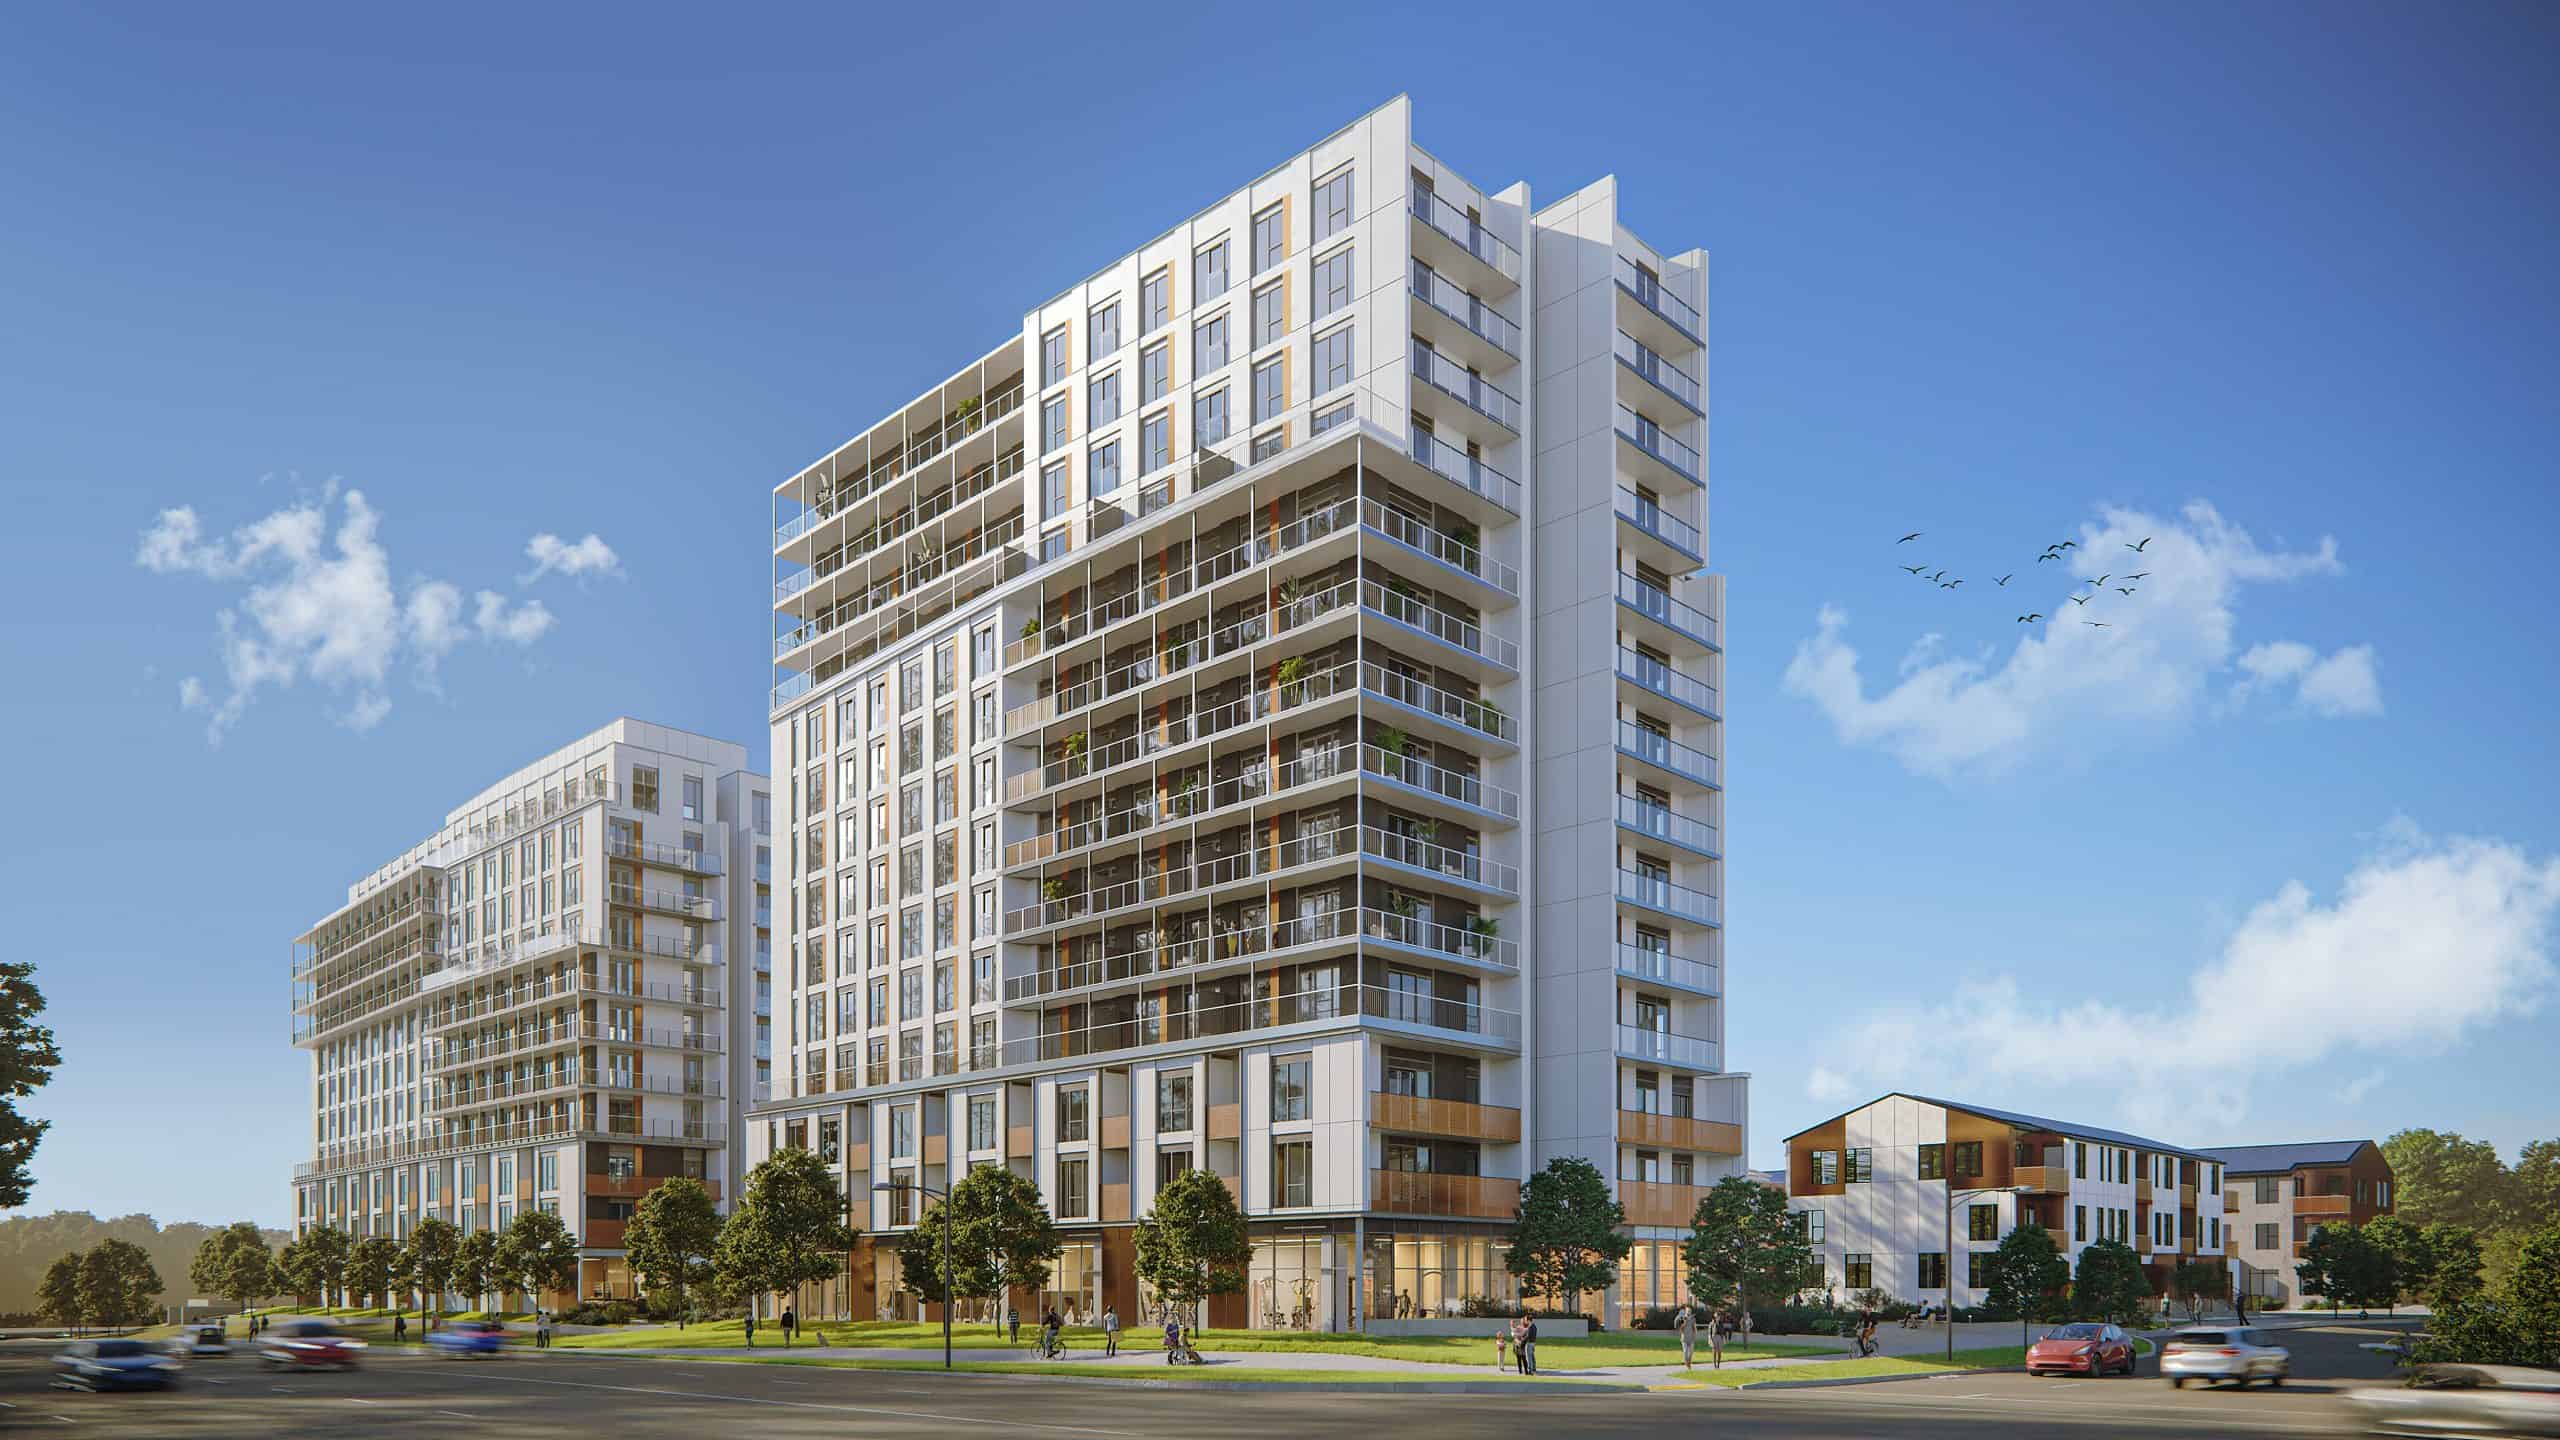
Daniels MPV 2 - Stacked
Daniels Corporation · Mount Pleasant Village
From From $847,900
Questions people ask about Mount Pleasant
- What are homes worth in Mount Pleasant?
- The only public figure is the 2021 Census, where owners in Mount Pleasant put the value of their homes at a median of $1,000,000 (average $1,073,000). That is owner reported and dated May 2021, not a current market value. A licensed agent prepares a free assessment from recent sales nearby.
- What kind of homes are in Mount Pleasant?
- Detached houses make up about 66% of the 7,565 occupied homes counted in Mount Pleasant in the 2021 Census.
- Is Mount Pleasant mostly owners or renters?
- About 81% of households in Mount Pleasant owned their home in the 2021 Census and 19% rented.
- Are new homes being built in Mount Pleasant?
- Yes. LIQWD lists 3 new home projects inside Mount Pleasant today, with pricing where the builder has released it.
- Who can tell me what my Mount Pleasant home would sell for?
- A licensed local agent. The free assessment on this page goes to a verified agent who prices it from recent sales around your street, with no instant estimate and no obligation.